https://ascensi.ro/en/insights/the-hidden-cost-of-turnover
Talent Economics
Turnover Never Appears on the P&L. That Is Why It Costs So Much.
One departure costs 50–200% of annual salary. None of it lands as a single line in your accounts — the invisible version keeps winning the budget argument.

Ascensi Management · 5 min read
The briefFor CFOs5 min read
- Price your five most recent departures across all four lines: recruitment, onboarding, lost output and manager hours.
- Find the managers who lost more than one person last year, and the exits that came before month 18.
- Set what a 20% cut in turnover is worth at your own numbers against the cost of the program that would deliver it.
On this page
The most expensive people risk on your P&L is the one your accounting system was never designed to show you.
A departure never arrives as an invoice. It costs what it costs across four different budgets, four different months, and almost never against the name of the person who left (SHRM; MyCulture). By the time anyone adds it up, the number belongs to last year — and to nobody.
The four lines hiding inside one departure
- Recruitment cost. Fees, advertising, screening hours, interview time — the most visible part, and the smallest one.
- Onboarding time. The weeks before the replacement produces what the predecessor produced — measured in their salary, paid at full rate.
- Lost output. The work that did not happen while a seat was empty, or half-full, and the overtime that absorbed it.
- Manager hours. The most expensive line nobody tracks: exit conversations, recruitment rounds, training, and the team's meetings that turn into therapy sessions.
| What it measures | Published figure | Source |
|---|---|---|
| the replacement-cost band in Romanian HR analyses, working from local payroll data | 50–200% of salary | Zarina CRM (RO), 2026-07-22 |
| bad-hire cost at the middle-management level, by the most-cited international benchmark | 100–150%, mid-level | SHRM, 2017-05 |
| bad-hire cost at the C-suite level, by the same research tradition | up to 213%, C-suite | MyCulture, 2026-03 |
| the conservative cost of one wrong entry-level hire for a 20-person Romanian SME | 15–22K lei, entry level | BusinessIMM (RO), 2026-08 |
- What it measures
- the replacement-cost band in Romanian HR analyses, working from local payroll data
- Published figure
- 50–200% of salary
- Source
- Zarina CRM (RO), 2026-07-22
- What it measures
- bad-hire cost at the middle-management level, by the most-cited international benchmark
- Published figure
- 100–150%, mid-level
- Source
- SHRM, 2017-05
- What it measures
- bad-hire cost at the C-suite level, by the same research tradition
- Published figure
- up to 213%, C-suite
- Source
- MyCulture, 2026-03
- What it measures
- the conservative cost of one wrong entry-level hire for a 20-person Romanian SME
- Published figure
- 15–22K lei, entry level
- Source
- BusinessIMM (RO), 2026-08
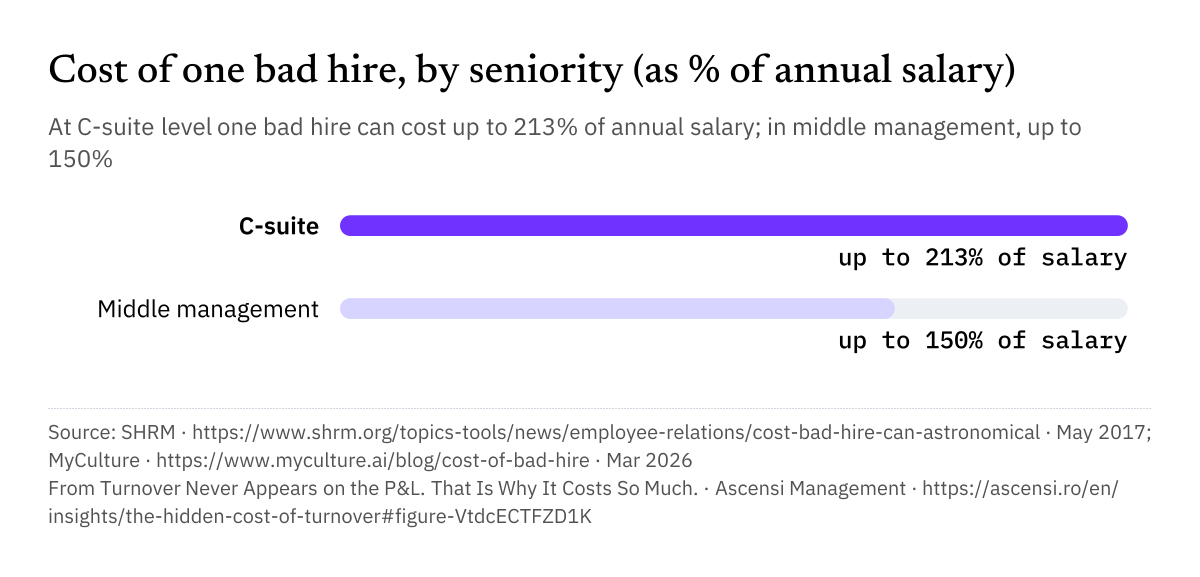
The details differ by source; the order of magnitude does not. The Romanian comparators are built from local payroll and replacement data (Zarina CRM; BusinessIMM), and they land in the same band, which is what turns “50–200%” from a slogan into a planning assumption.
Your number, in thirty seconds
The calculator's default turnover, 20% a year, is the Romanian private-sector benchmark cited further down; the €18,000 average salary is a placeholder. Change both to your own; the arithmetic is the one your CFO will use when asked.
Calculator
Cost of staff turnover
An estimate from your inputs: a range, not a forecast.
Your input stays on this page. It is not stored anywhere else.
The result is a range, because replacement cost varies with role, market and timing (European benchmarks; AmCham Romania). A range with your own headcount in it still beats both opinions: the CEO who says turnover is normal, and the HR lead who says it is expensive.
Why it stays invisible
“Most companies don't know the full cost of the turnover — so they don't apply the resources upfront to avoid it.”
Art Nathan, founder, The Arte of Motivation (HR advisory)
Source: shrm.org
The mechanics are mundane. Finance tracks what arrives as a transaction: an invoice, a payroll line, a fee. Turnover arrives as an absence — productivity that did not happen, hours that went elsewhere, a team that slowed down. Absences do not generate documents. So the cost is paid in full and recorded nowhere (cost breakdowns for Romanian employers include exactly these categories among the hidden ones).
The pressure behind it shows in the 2026 data: in Randstad's 2026 HR Trends study, 28% of employees who resign cite excessive workload as the trigger — a cause no salary line fixes and no finance report records (Randstad Romania).
One honesty note: the Romanian benchmarking source pairs its turnover figure with a 2022 underlying dataset — treat the 20% as directional, not current-quarter. Your calculator result uses your own inputs precisely so this caveat cannot touch it.
Four questions to ask before the next budget round
- What did our five most recent departures actually cost? (If the answer takes a week, that is the answer.)
- What share of last year's exits happened before month 18 — the window where selection, more than the market, tends to be the cause?
- Which managers lost more than one person in the last year? That is where the next resignation is already priced in.
- What would a 20% reduction in turnover be worth on our own calculator numbers? Compare it to the cost of the program that would achieve it.
The bottom line
Turnover is an operations cost with an HR label: paid by the P&L and recorded by no one. The companies that put a number on it get a defensible figure, and a defensible figure is what lets a company stop arguing about whether retention deserves budget and start deciding how much of the number to remove.
Our Organizational Diagnosis puts a price on the turnover your accounts do not show and traces it to where it starts: selection and the manager layer.
Cite this article
Ascensi Management (9 Oct 2026). Turnover Never Appears on the P&L. That Is Why It Costs So Much. Ascensi Management Insights. https://ascensi.ro/en/insights/the-hidden-cost-of-turnover
Cite this article with this credit; for a figure, credit the source shown under it.
Sources
- SHRM — “The Cost of a Bad Hire Can Be Astronomical”, SHRM, May 2017
- MyCulture — “Cost of Bad Hire: 2026 Quantified”, MyCulture, Mar 2026
- Zarina CRM (RO) — “Fluctuația de Personal: Cauze și Strategii de Reducere 2026”, Zarina CRM, 22 Jul 2026
- BusinessIMM (RO) — “Cifra reală a unei angajări greșite pentru un IMM din România în 2026”, BusinessIMM, Aug 2026
- AmCham Romania — Labour Market Analysis (PwC Saratoga), AmCham Romania, Sep 2023
- Euro HR Solutions — turnover benchmarks, Euro HR Solutions, 27 May 2026
- Personnel.com.ro (RO) — “Cât costă, de fapt, un angajat în România în 2026”, Personnel.com.ro, Feb 2026
- Randstad Romania — HR Trends 2026, Randstad Romania, 6 Feb 2026
Related service
Organizational Diagnosis
The place to start: a first scan of your company, setting what your people say beside their Skill and Will — where you lose money and people, and the gaps to close first. It opens onto HR Strategy Advisory.
Related articles
 Culture EconomicsArticle
The Pay-Rise Trap: 83% plan raises, only 34% expect growth
7 min read · 9 Oct 2026 Available in English and Romanian
 Boardroom StrategyArticle
The AI Act Is Live. The Compliance Line Your Budget Is Missing.
9 min read · 9 Oct 2026 Available in English and Romanian
 FeaturedLeadershipArticle
The 82%: Managers Nobody Trained, Teams Paying the Price
5 min read · 9 Oct 2026 Available in English and Romanian
Newsletter